Forecasting -
Error Measures
Suppose you have the sales information between
Period 1 and Period 10. You need to do the sales forecast and use
indicators to evaluate model (Bias, MAD, MAPE, MSE, Std Error)
|
Period |
Sales |
|
1 |
60 |
|
2 |
67 |
|
3 |
50 |
|
4 |
58 |
|
5 |
62 |
|
6 |
60 |
|
7 |
55 |
|
8 |
62 |
|
9 |
71 |
|
10 |
65 |
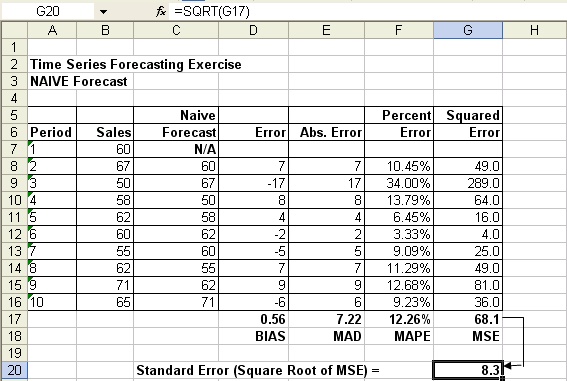
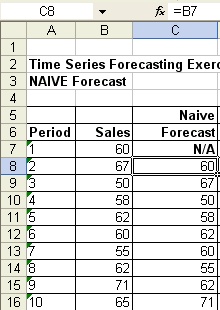
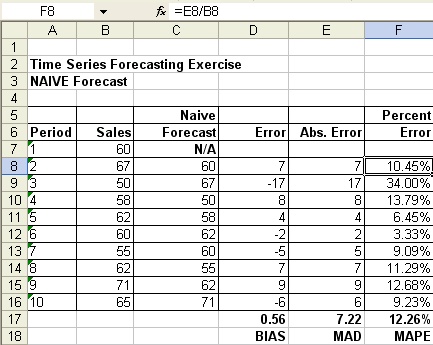
1) Naive Forecast - use last periods number as
your forecast. Since you're using last periods number as your forecast,
the forecast for Period 1 is NOT available.
- You will then need to copy the formula from
cell C8
- Go to C8 - Edit/Copy
- Highlight C9 - C16 - Edit/Paste
1) Error & Bias
- The difference between the actual production
(sales) and forecast is the error
- Bias is the average of the error


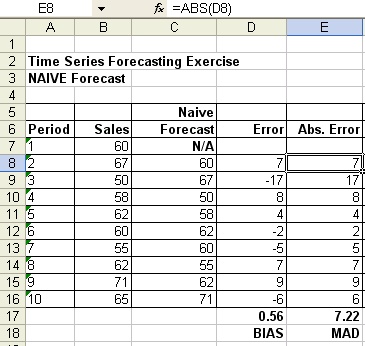
2) Absolute Error & MAD
- Absolute Error is the absolute value of the
Error
- MAD
- Mean Absolute Deviation
- The average of the absolute error
3) Absolute Percentage Error & MAPE
- Absolute
Percentage Error is the percentage of the absolute error vs. the actual
production (sales)
- MAPE
- Mean Absolute Percentage Error
-
Calculate the % of the error using the
absolute error, then average the results
4) Squared Error & MSE
- Squared error (not absolute error)
- MSE
- Mean Square Error
- The average of the square error
- Standard Error - Square root of MSE
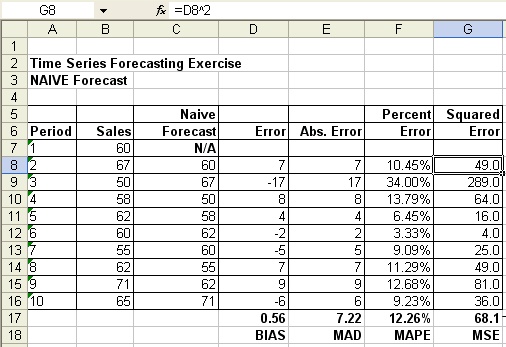

5)
Standard Error
- Standard Error - Square root of MSE