In Excel 2007 or 2010, select Office Button
 and click on
Excel Options and Add-ins, a window
will open that looks like this:
and click on
Excel Options and Add-ins, a window
will open that looks like this:Excel Regression Tutorial
Before you can perform a linear regression with
Excel, you need to make sure the "add-in" is installed.
In Excel 2007 or 2010, select Office Button
and click on
Excel Options and Add-ins, a window
will open that looks like this:
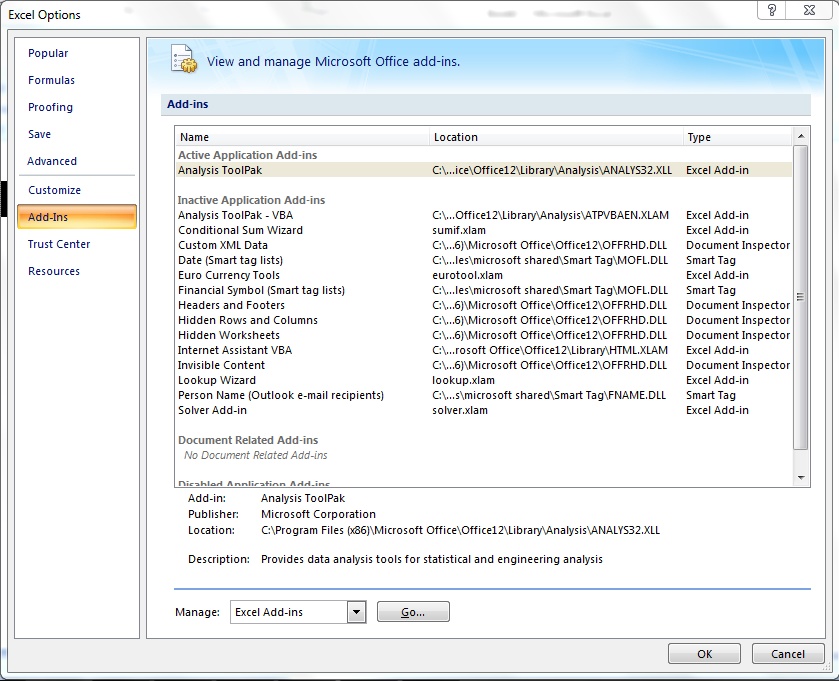
Click on Go.
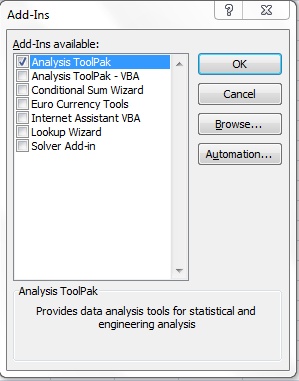
Make sure the "Analysis Tookpak" box is checked, then click OK.
A linear regression is just a statistical tool used to determine whether or not two (or more) variables are linearly related.
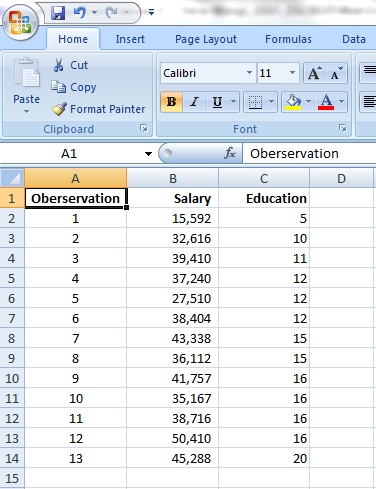
Suppose you want to determine whether a person's
salary is a function of his or her education level (measured in years).
The general form of the relationship is:
Yi = a + bXi + errori
where:
You start by collecting a random sample of observations, and recording them in your spreadsheet. For ease of computation, it helps to put the dependent variable (Y) in the left column, and the independent variable (X) in the right column. In our example below, Y is Salary and X is Education.
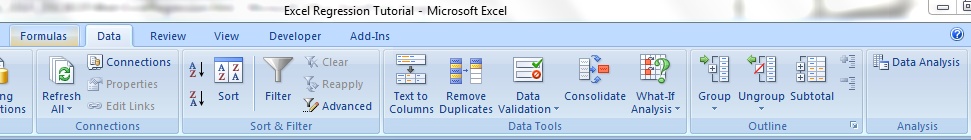
Click on "Data" tab and then "Data Analysis":
Scroll down until you see the "Regression" tool, click on it, then click OK.
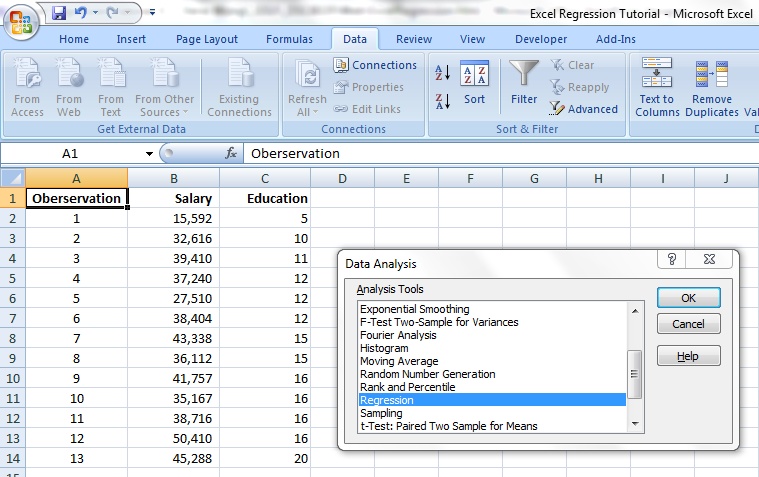
You will see a box like this:
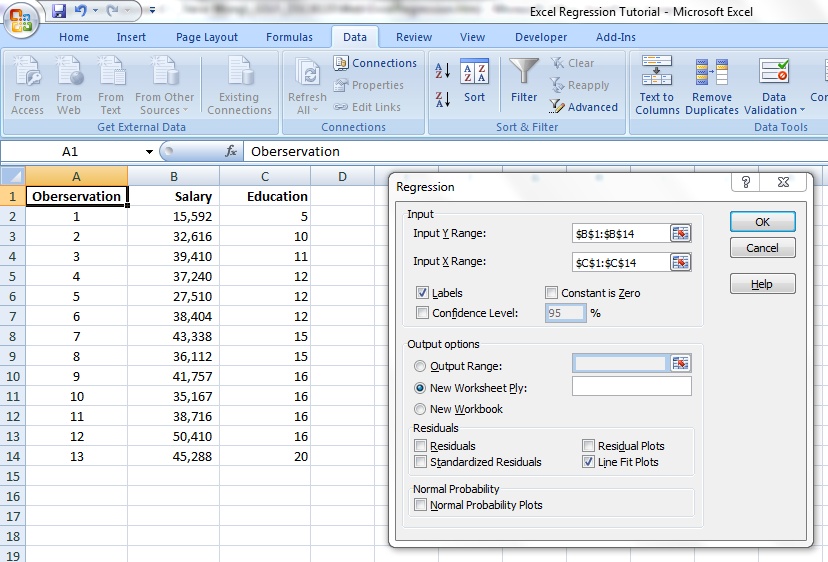
Click inside the box labeled "Input Y Range:" and then click on cell B1 and hold the left mouse button down and highlight cells B1 through B14
Next, click inside the box labeled "Input X Range:" and then click on cell C1 and hold the left mouse button down and highlight cells C1 through C14
Since we have labels at the top of each data column (and included their cells in the ranges above) click the "Labels" checkbox and then click the "Line Fit Plots" checkbox.
Now, click OK and Excel will perform the linear regression, and put the output on a new page:
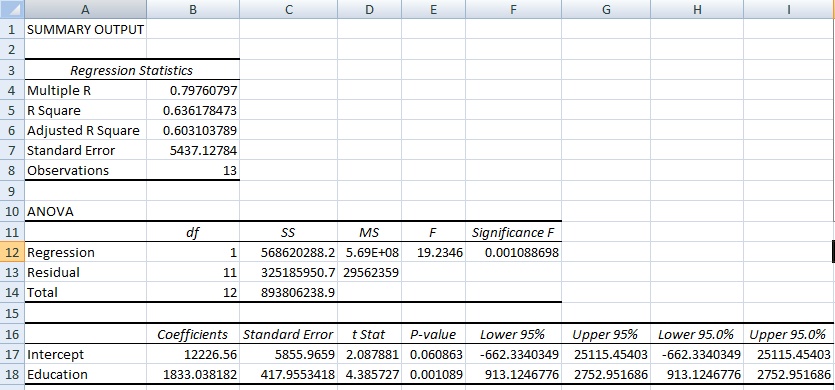
Cell B17 contains the "intercept" i.e. the value of "a" from the equation: Yi = a + bXi + errori
Cell B18 contains the slope, i.e. the value of "b" from the equation: Yi = a + bXi + errori
So, our regression equation is: Salary =
12,226 + 1833(Education)
We interpret it as: on average, a person's salary is $12,226 plus $1,833 each
year of education he/she has.
We should also look at the "Adjusted R Square" statistic in cell B6 to determine how strong the relationship between salary and education is. In this case, its value is 0.60, which indicates that about 60% of salary is determined by education (so about 40% is determined by other factors).
We can also look at the line fit plot to get a
visual feel for how "linear" the relationship is:
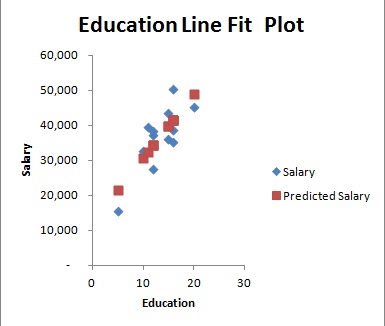
The pink squares show the "predicted" relationship, i.e. a perfectly straight line from the equation: Yi = a + bXi
The dark blue diamonds show the actual
relationship: Yi = a + bXi + errori
The error term accounts for the fact that the part of salary is due to other
factors not included in our model.