Multiple Linear Regression
The regression procedure is used when you are interested in describing the
linear relationship between the independent variables and a dependent variable.
- Click Tools > Data Analysis.... If you don't have a Data Analysis option
under Tools, see step #3 of "How do I get
started with Excel?".
- In the window titled Data Analysis select Regression and click OK.
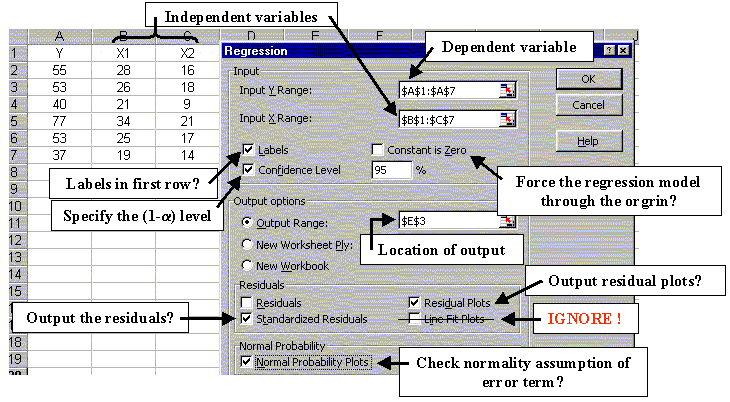
- A new window titled Regression should appear. This window has many
options. Below is a brief explanation of each:
- Highlight the dependent variable (including the variable name) and put
into Input Y Range:.
- Highlight the independent variable (including the variable names) and
put into Input X Range:
- Click Labels, if the variable names were included under the Input Range.
- Constant is zero should be highlighted if one wants to fit a model
without an intercept. This rarely needs to be selected.
- Click Confidence Level, if you want to change the level of confidence
when creating intervals for the regression parameters.
- You must select one of the following Output options:
- Click Output Range if you want the test results to be placed on the
current sheet. Next, simply input the cell where you want the output to be
placed.
- Click New Worksheet Ply if you want the test results to be placed on a
new sheet. Next, type the name of the new sheet where you want the output
to be placed.
|
Residuals ( Optional )
Residuals are used to check the regression assumptions. Excel will output
residual information when doing a regression analysis. The following is a
short explanation about residual output.
- Click Residuals to output the residual values. The residual value is
simply the difference between the observed value and the fitted value.
- Click Standardized Residuals to output the standardized residual
values. Standardized residual values, unlike residual values, are
invariant to the scale of measurement. Standardized residuals can be
used to check for outliers in the data. If the standardized residual
value is above 3 or below -3, the observation is a potential outlier.
- Click Residual Plots to return the residual scatterplot(s). The
scatterplot(s) allow us to visually check the regression assumptions. If
the scatterplot(s) have any significant pattern, the regression
assumptions are being violated.
- Ignore Line Fit Plots when doing
multiple regression.
- Normal Probability Plots are used to check the normality assumption
of the error term (or residuals). Click Normal Probability Plots to
output the normal probability plot.
|
- Click OK. The test results and outputted scatterplots will be placed onto
your spreadsheet.
Note:
Another very useful residual plot is a plot of
fitted values versus standardized residuals. Excel does not output this plot,
but the fitted values (or predicted values) and the standardized residuals can
be obtained easily by selecting ?? Residuals ?? and Standardized Residuals
above. Once these values are returned, simply constuct the scatterplot, see
How do I create a scatterplot? for more
information.
An example, perform a regression analysis with Y (dependent variable) on X1 and
X2 (the independent variables). Use
 = 0.05 for the analysis. Return the residuals, standardized residuals, and the
normal probability plot. Place the output into cell $E$3.

![]() = 0.05 for the analysis. Return the residuals, standardized residuals, and the
normal probability plot. Place the output into cell $E$3.
= 0.05 for the analysis. Return the residuals, standardized residuals, and the
normal probability plot. Place the output into cell $E$3. 